Using satellite data, AI, and real-time ocean sensors to understand and protect marine ecosystems.

Ocean Chlorophyll concentration, Fluorescence line height, Total Absorption at 412nm, Total Backscattering at 412nm, Diffuse Attenuation coefficient at 490nm, Particulate Inorganic Carbon, Remote Sensing reflectance at 412nm and Sea Surface Temperature
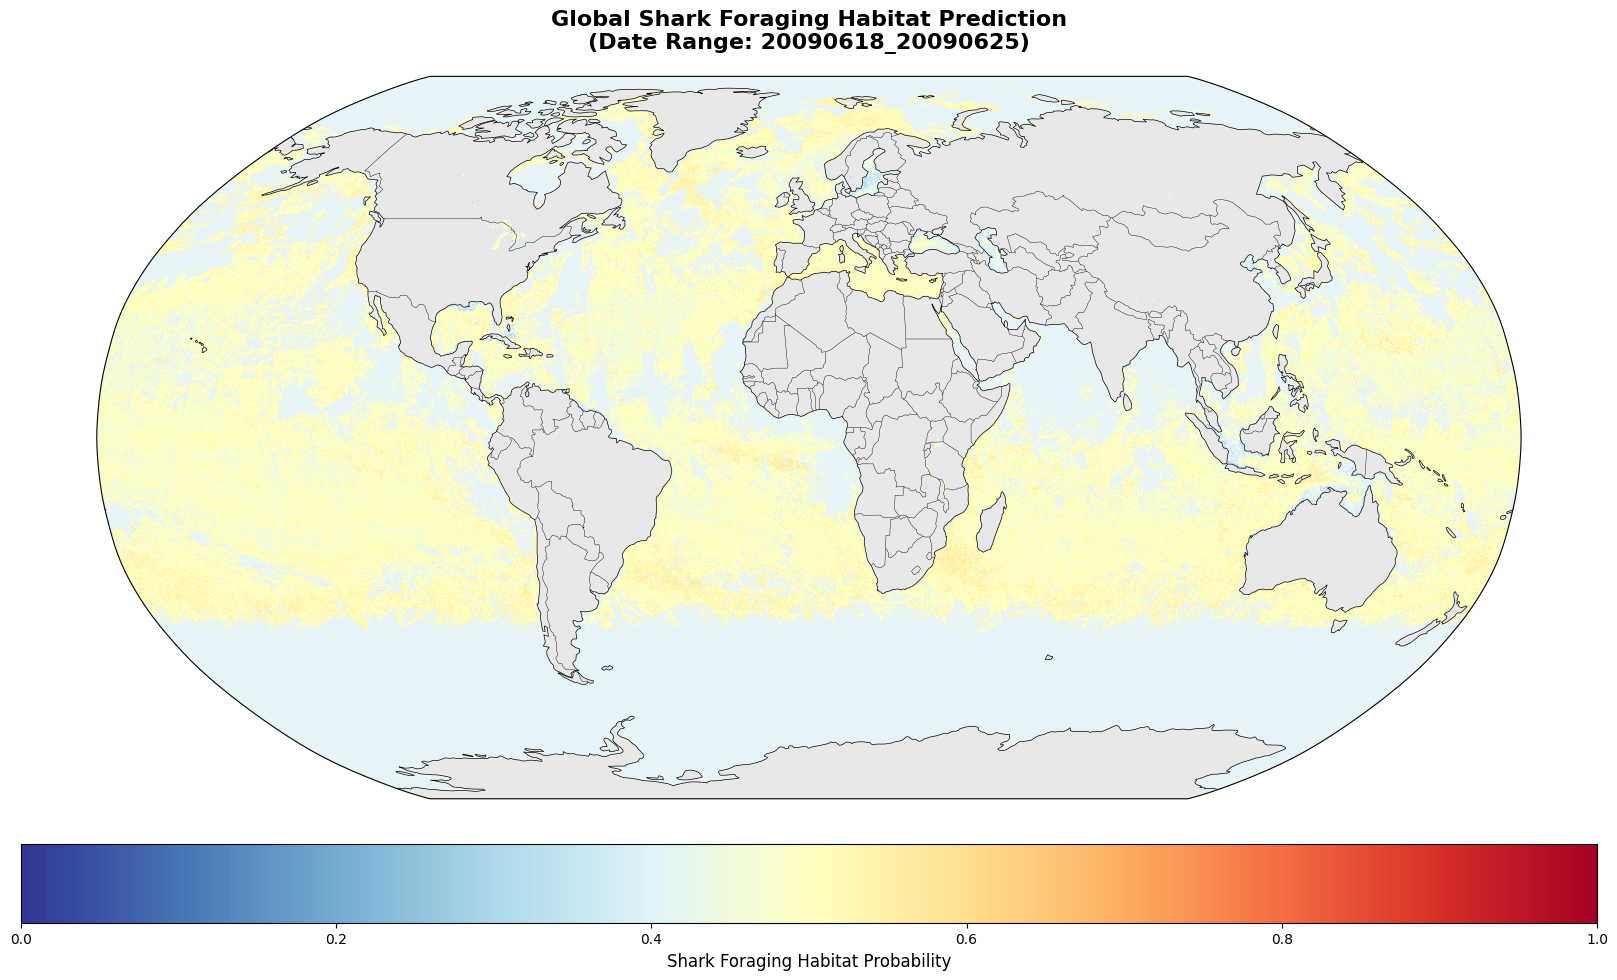
Predicts foraging zones based on location and enviromental factors.
Non-invasive sensors attached to sharks record depth, temperature, images, and movement, transmitting data when near a buoy.
Specialized buoys are deployed in predicted zones to gather in-situ ocean data and receive transmissions from tagged sharks.
The system operates in two modes: synchronous (direct GPS or satellite link) and asynchronous (data stored until contact with a buoy).
All transmitted data — both synchronous and asynchronous — is unified, processed, and analyzed to refine movement predictions and environmental correlations.
Our project combines satellite data, artificial intelligence, and ocean-based technology to monitor, predict, and protect shark habitats — ensuring the survival of these vital apex predators.

Track how information moves from sharks to satellites through smart tags and buoys, ensuring timely insights for conservation and research.
Synchronous Transmission: Real-time data sent directly to GPS and monitoring systems.
Asynchronous Storage: Data buffered in smart tags until a buoy can relay it to satellites.
Integrated Feedback: All collected information feeds prediction models to optimize buoy placement and shark tracking.
Take a look at this 3D model that lets you interact with our Tag concept for highly migratory medium-large sharks.
Understanding shark movements and behavior is essential to preserving ocean ecosystems and maintaining the balance of marine life.
Ecosystem Guardians: Sharks regulate species populations, keeping oceans healthy.
Critical Habitats: Data highlights key foraging and breeding areas requiring protection.
Enter environmental parameters to generate a model prediction for shark activity in a specific ocean region.
Predicted shark foraging zones based on satellite and sensor data. Areas with higher activity are highlighted in red, lower activity in blue.